Disclaimer: The author's original intention was to share and popularize knowledge about network security. If readers engage in any harmful activities related to network security as a result, they are responsible for the consequences and have no connection with the author or this website.
Neither I nor this website have ever provided any information or materials about any websites, companies, or organizations to anyone.
Background#
For the purpose of learning, every network security enthusiast like me will inevitably have some "pants" leaked online.
Therefore, with the increase in data volume and the need for information gathering in legal penetration testing, it is necessary to build a local social engineering database that can be queried quickly and accurately.
So what environment is needed to build it?
Currently, most of the social engineering databases built online use the mysql+coreseek+php architecture. Coreseek is based on Sphinx, an excellent full-text search engine. However, its drawback is that it is relatively lightweight. Once the data volume exceeds hundreds of millions, it becomes somewhat inadequate. Moreover, building a cluster for distributed performance is not ideal. If you consider the situation where the data volume will continue to increase in the future, you still need to use other solutions.
Here, I will use a method called "ELK," which was originally an open-source real-time log analysis platform.
This article will introduce the setup of the "ELK" environment and commonly used methods for data import and query.
Introduction to ELK#
What is ELK?
ELK is an abbreviation for three open-source software: Elasticsearch, Logstash, and Kibana. They are all open-source software. However, a new tool called Beats has been added. It is a lightweight log collection and processing tool (Agent). Beats consumes fewer resources and is suitable for collecting logs on various servers and transmitting them to Logstash. The official also recommends this tool. Currently, due to the addition of the Beats tool to the original ELK Stack members, it has been renamed Elastic Stack. The Elastic Stack includes:
Elasticsearch is an open-source distributed search engine that provides three major functions: data collection, analysis, and storage. Its features include: distributed, zero-configuration, automatic discovery, automatic sharding of indexes, index replication mechanism, RESTful-style interface, multiple data sources, automatic search load balancing, etc. For more details, please refer to the Elasticsearch Definitive Guide.
Logstash is mainly used for log collection, analysis, and filtering. It supports a large number of data acquisition methods. The general working mode is a client/server architecture, where the client is installed on the host that needs to collect logs, and the server is responsible for filtering and modifying the logs received from various nodes before sending them to Elasticsearch.
Kibana is also an open-source and free tool. Kibana provides a user-friendly web interface for log analysis provided by Logstash and Elasticsearch. It can help summarize, analyze, and search for important data logs.
Beats is a lightweight log collector here. In fact, the Beats family has six members. In the early ELK architecture, Logstash was used to collect and parse logs. However, Logstash consumes more resources such as memory, CPU, and IO. Compared with Logstash, the CPU and memory consumed by Beats are almost negligible.
ELK Stack (after version 5.0) --> Elastic Stack == (ELK Stack + Beats). Currently, Beats includes six tools:
Why use ELK?
Traditional social engineering databases usually use MySQL databases for construction, and the retrieval efficiency is very low for a considerable amount of data. In this relational database, querying requires specifying column names. In Elasticsearch, full-text search is available, and the response in large data queries is almost in milliseconds, which is very fast! ELK was originally used for large-scale log collection and analysis, and its incredible speed makes it a good choice for social engineering databases.
ELK Official Website, Download ELK Software, ELK Chinese Guide (Login Required)
Setting up the ELK Environment#
Configuring the Java Environment#
ELK requires support from the Java environment and the configuration of the JAVA_HOME environment variable.
Due to the confusion between the charging and non-charging versions of Java, I have always used version 8 of Java.
Here is the JDK environment I have been using: Click here to download. It can also be used directly with Burp Suite 1.7.
However, Elasticsearch has already indicated that it will no longer support Java 8 and recommends upgrading to Java 11 as soon as possible. Here, I will also introduce JRE and JDK:
The former is Java Runtime Environment, which is the minimum environment for running Java files.
The latter is Java SE Development Kit, which is the development environment toolkit for Java programming.
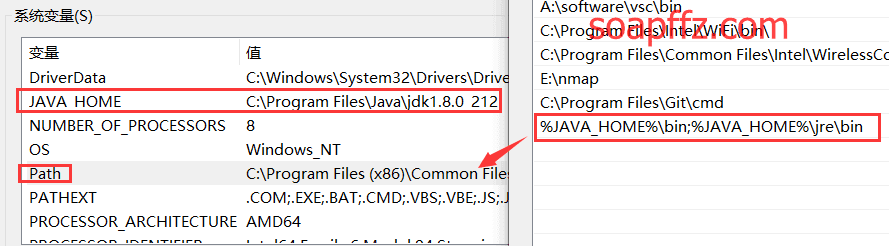
For beginners, it is recommended to directly install JDK, which includes JRE. After downloading, remember to manually add the installation location to the environment variables:
The default installation path for Java is "C:\Program Files\Java," which contains both JRE and JDK. There is also a "jre" folder inside the "jdk" folder. Create a new system variable called "JAVA_HOME" with the value set to the JDK path.
Then, add "%JAVA_HOME%\bin;%JAVA_HOME%\jre\bin" to the "PATH" variable. This will configure the "JAVA_HOME" environment variable.
Basic Operation#
After downloading the Elasticsearch, Logstash, and Kibana zip files and extracting them,
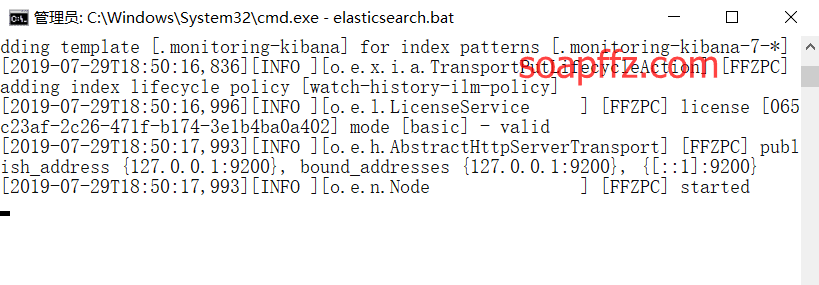
- Open the command prompt in the "bin" directory of the Elasticsearch folder and enter "elasticsearch.bat":
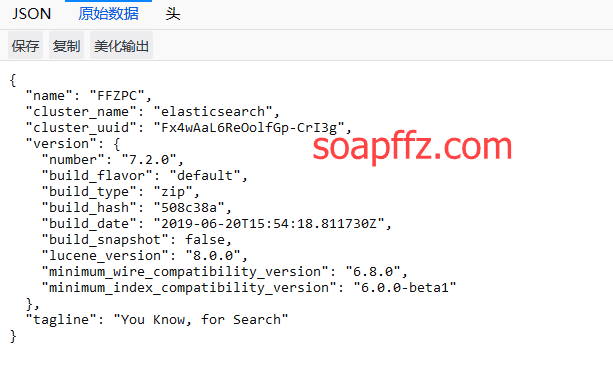
Open the browser and go to "http://localhost:9200/":
- In the "kibana" folder, open the "config\kibana.yml" file and change the following line at the end:
#i18n.locale: "en"
to:
i18n.locale: "zh-CN"
Save the file and click on the "bin\kibana.bat" file in the "kibana" folder.
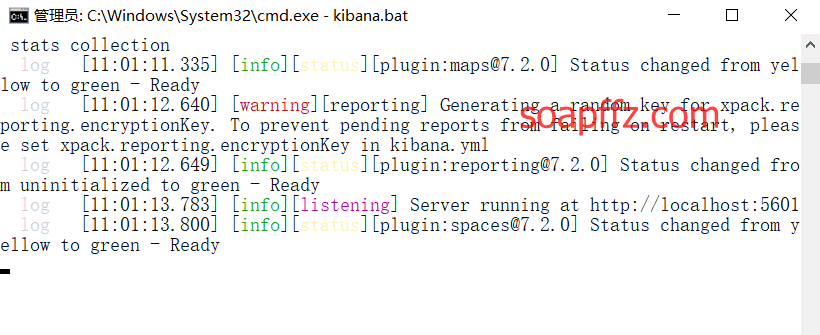
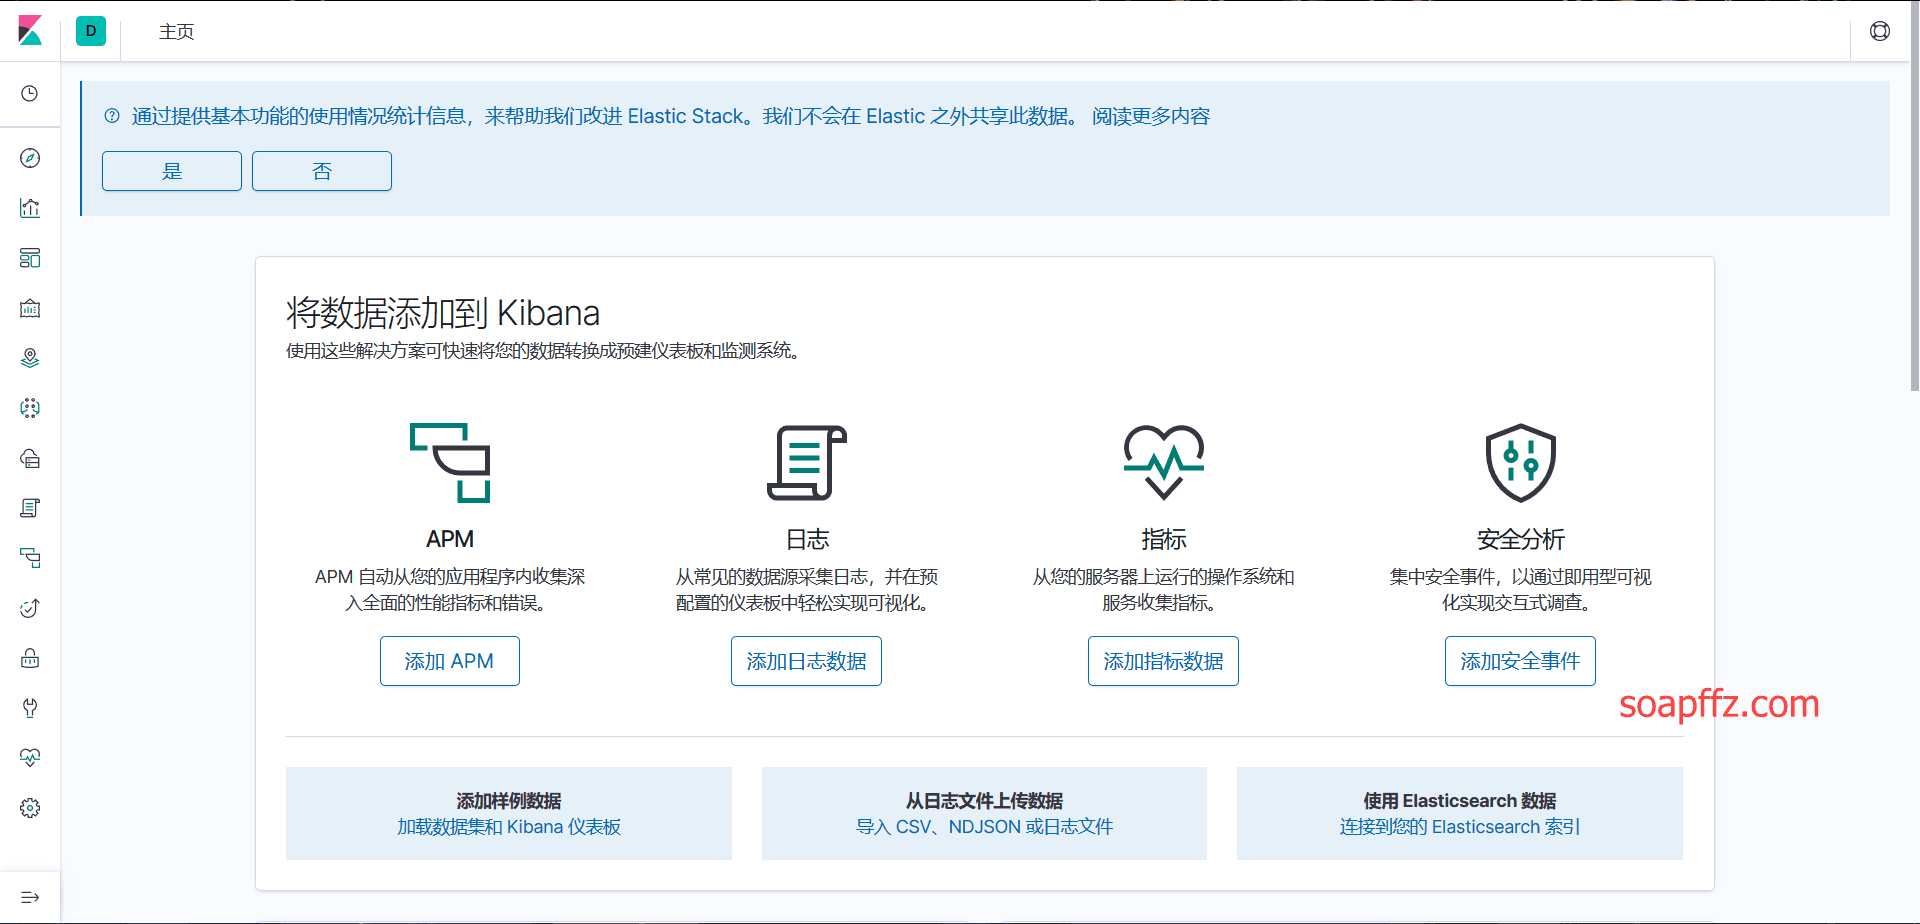
Open the browser and go to "http://localhost:5601". The initial interface will look like the following:
At this point, it should be up and running. Here are a few main configuration files and their functions:
The main node configuration file "elasticsearch.yml" is called the main node because ELK was originally designed for distributed architecture log analysis.
The location is "elasticsearch\config\elasticsearch.yml," and it is generally not recommended to modify it. The default settings should be sufficient.
# Disable virtual memory to improve performance
bootstrap.memory_lock: true
# Customize the cluster name
cluster.name: elasticsearch
# Data communication port
http.port: 9200
# Listening network card IP
network.host: 192.168.1.1
# Is it a data node?
node.data: true
# Turn off
node.ingest: true
# Is it a master node? If not defined, the first node started will be the master node
node.master: true
# Maximum storage nodes
node.max_local_storage_nodes: 1
# Customize the node name
node.name: Win-Master-1
# Data file path
path.data: D:\elk\elasticsearch\data
path.logs: D:\elk\elasticsearch\logs
# Node communication port
transport.tcp.port: 9300
# Node IP, nodes need to allow ping and communication on port 9300
discovery.zen.ping.unicast.hosts: ["192.168.1.1", "192.168.1.2"]
# Head plugin related
http.cors.enabled: true
http.cors.allow-origin: "*"
# Enable external access with 0.0.0.0
network.host=0.0.0.0
Data Import#
This is as far as I can go for now. I will continue tomorrow.
Common Techniques#
Reference articles:
- https://www.t00ls.net/thread-32593-1-1.html (Only available to T00ls members)
- Building a Secure Authentication ELK Log System
That's all for this article.